library(arrow)
# install_arrow()
library(sf)
library(dplyr)
library(tigris)
library(rdeck) # pak::pak("rdeck")
options(tigris_use_cache = TRUE)Getting and visualizing Overture Maps buildings data in R
r
gis
data science
spatial analysis
open data
I’ve been following with great interest the development of the Overture Maps Datasets. Overture is a collaborative project from Microsoft, Amazon, Meta, and many others to produce standardized and open geospatial datasets for developers to use in their applications. The core datasets available in Overture include:
- Administrative boundaries;
- Land and water features;
- Building footprints and roofprints;
- Points of interest (POIs);
- Transportation layers, like roads and public transit ways.
These datasets are phenomenal resources for analysts and developers. However, the recommended methods of data access can be tricky to use, especially for or analysts who are less familiar with DuckDB and Amazon Web Services.
Fortunately, thanks to the arrow R package, R users can query and use Overture data with familiar tidyverse tools!
Today, we’ll be working with the buildings dataset. Let’s load in a few libraries to get started. We’ll be using the arrow package to connect to a remote directory of Parquet files, which is the format in which the Overture Maps datasets are stored. The sf package will allow us to parse spatial information in the data; dplyr will allow us to query the data; and we’ll be visualizing the data with the Deck.gl library, available in the rdeck package. The tigris package will allow us to easily grab a US county bounding box to help us filter the buildings dataset.
If you haven’t set up the arrow package before, you’ll need to first load the package then run the install_arrow() function. By default, the arrow package when installed from CRAN ships with minimal features. To get the full feature set (which we’ll be using in this workflow), you can use the install_arrow() function to set that up for you.
We’re now ready to connect to the Overture Maps buildings data. The magic tool we’ll be using is the open_dataset() function. open_dataset(), when pointed to a directory of local or remote Parquet files, allows us to connect to those files much like we would to a database. This means that we can access huge datasets without having to load them into memory!
To connect to the buildings dataset, we’ll point open_dataset() to the appropriate S3 address. Once we connect to the data, let’s take a look at how many buildings we have access to:
buildings <- open_dataset('s3://overturemaps-us-west-2/release/2024-05-16-beta.0/theme=buildings?region=us-west-2')

nrow(buildings)
[1] 2358259383You’ve read that right - we’ve connected to a whopping 2.35 billion building footprints around the globe.
In almost all practical use-cases, we won’t want to use all of those buildings at once. Because open_dataset() establishes a database-like connection to the buildings dataset, we can use dplyr to query it. I’m determining a bounding box for San Francisco by grabbing data from the tigris package; try swapping in another US county when you are running this yourselves.
To pull in buildings for San Francisco into R, we’ll filter the buildings dataset for those buildings that fall within San Francisco’s bounding box, then select the id, geometry, and height columns to make our dataset smaller. collect() pulls the data into R, at which point we convert the dataset to a spatial (sf) object. I’m giving all buildings with missing height values a height of 8 meters to show texture when we visualize the data.
sf_bbox <- counties(state = "CA", cb = TRUE, resolution = "20m") |>
  filter(NAME == "San Francisco") |>
  st_bbox() |>
  as.vector()

sf_buildings <- buildings |>
  filter(bbox$xmin > sf_bbox[1],
         bbox$ymin > sf_bbox[2],
         bbox$xmax < sf_bbox[3],
         bbox$ymax < sf_bbox[4]) |>
  select(id, geometry, height) |>
  collect() |>
  st_as_sf(crs = 4326) |>
  mutate(height = ifelse(is.na(height), 8, height))
We’re now ready to visualize the data with Deck.gl. The rdeck package is an excellent R interface to Deck.gl; it is not available on CRAN, so you can install with pak::pak("rdeck") or remotes::install_github("qfes/rdeck"). We’ll visualize the buildings in 3D based on values in the height column, and color the buildings relative to their heights as well.
rdeck(map_style = mapbox_light(),
      initial_view_state = view_state(
        center = c(-122.4657, 37.7548),
        zoom = 11.3,
        bearing = -60,
        pitch = 76
      )) |>
  add_polygon_layer(
    data = sf_buildings,
    name = "San Francisco",
    get_polygon = geometry,
    get_elevation = height,
    get_fill_color = scale_color_linear(
      col = height,
      palette = viridisLite::inferno(100, direction = -1)
    ),
    extruded = TRUE,
    opacity = 0.5)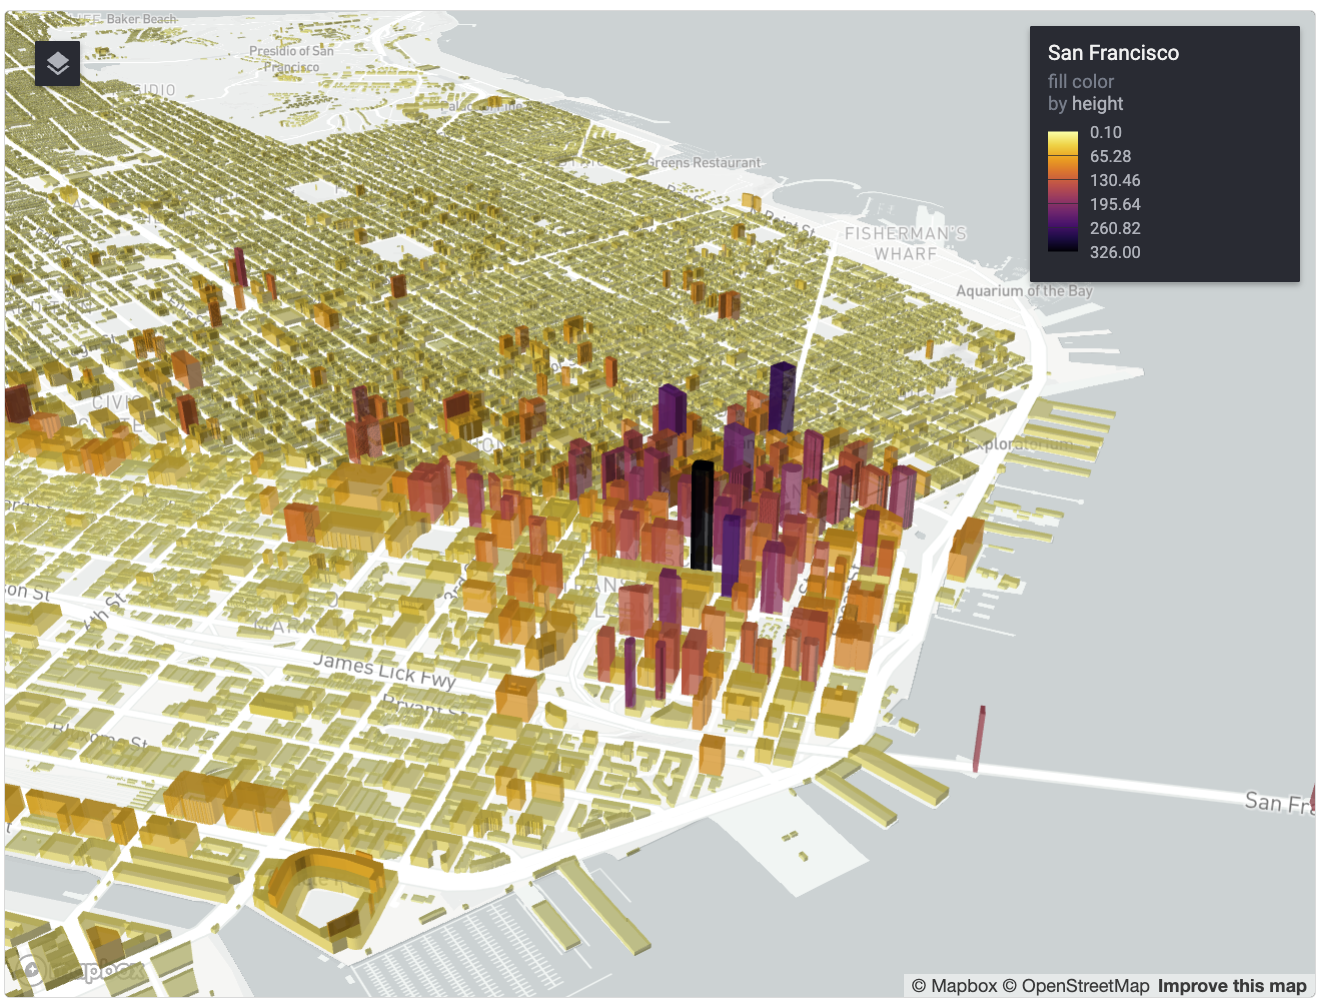
We’ve visualized San Francisco’s buildings in 3D, directly within R! Explore the map by zooming and panning, and hold the Control or Command keys while panning to modify the pitch and bearing of the map.
Based on my read of the Overture Maps documentation, building heights are more complete in the United States than the rest of the world. To test this out, let’s apply this same workflow to Sydney, Australia.
sydney_bbox <- c(150.787520, -34.088237, 151.422667, -33.643521)

sydney_buildings <- buildings |>
  filter(bbox$xmin > sydney_bbox[1],
         bbox$ymin > sydney_bbox[2],
         bbox$xmax < sydney_bbox[3],
         bbox$ymax < sydney_bbox[4]) |>
  select(id, geometry, height) |>
  collect() |>
  st_as_sf(crs = 4326) |>
  mutate(height = ifelse(is.na(height), 4, height))
With Sydney’s buildings in hand, let’s make another 3D map:
rdeck(map_style = mapbox_light(),
      initial_view_state = view_state(
        center = c(151.186855, -33.871729),
        zoom = 12,
        bearing = -32.8,
        pitch = 81
      )) |>
  add_polygon_layer(
    data = sydney_buildings,
    name = "Sydney",
    get_polygon = geometry,
    get_elevation = height,
    get_fill_color = scale_color_linear(
      col = height,
      palette = viridisLite::mako(100, direction = -1)
    ),
    extruded = TRUE,
    opacity = 0.5)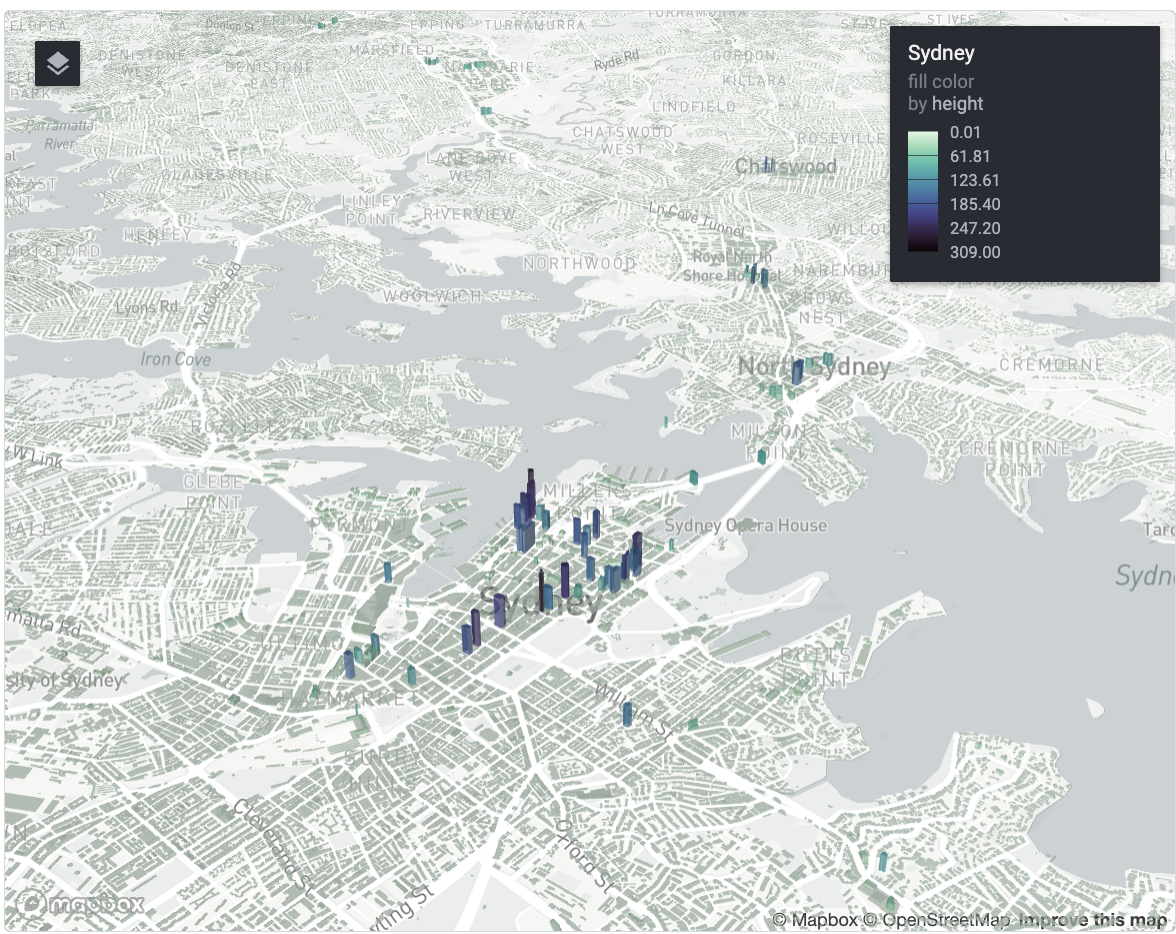
Some skyscrapers in downtown Sydney have heights available; however, most buildings do not (note the differences in how stadiums are rendered in San Francisco vs. Sydney). That said, Overture Maps is still a very new project, and with the resources behind it, I would anticipate that the data quality will continue to improve rapidly.