Performs spatial clustering using the SKATER algorithm (Spatial 'K'luster Analysis by Tree Edge Removal). The algorithm builds a minimum spanning tree from the spatial contiguity graph, then iteratively removes edges to create spatially contiguous clusters.
Usage
skater(
  data,
  attrs = NULL,
  n_regions,
  weights = "queen",
  bridge_islands = FALSE,
  floor = NULL,
  floor_value = 0,
  scale = TRUE,
  seed = NULL,
  verbose = FALSE
)
Arguments
- data
An sf object with polygon or point geometries.
- attrs
Character vector of column names to use for clustering (e.g.,
c("var1", "var2")). If NULL, uses all numeric columns.- n_regions
Integer. Number of regions (clusters) to create.
- weights
Spatial weights specification. Can be:
"queen"(default): Polygons sharing any boundary point are neighbors"rook": Polygons sharing an edge are neighborsAn
nbobject from spdep or created withsp_weights()A list for other weight types:
list(type = "knn", k = 6)for k-nearest neighbors, orlist(type = "distance", d = 5000)for distance-based weights
- bridge_islands
Logical. If TRUE, automatically connect disconnected components (e.g., islands) using nearest-neighbor edges. If FALSE (default), the function will error when the spatial weights graph is disconnected.
- floor
Optional. Column name specifying a floor constraint variable.
- floor_value
Numeric. Minimum sum of floor variable required per region. Only used if
flooris specified.- scale
Logical. If TRUE (default), standardize attributes before clustering.
- seed
Optional integer for reproducibility.
- verbose
Logical. Print progress messages.
Value
An sf object with a .region column containing cluster assignments.
Metadata is stored in the "spopt" attribute.
References
Assuncao, R. M., Neves, M. C., Camara, G., & Freitas, C. da C. (2006). Efficient regionalization techniques for socio-economic geographical units using minimum spanning trees. International Journal of Geographical Information Science, 20(7), 797-811.
Examples
# \donttest{
library(sf)
nc <- st_read(system.file("shape/nc.shp", package = "sf"))
#> Reading layer `nc' from data source
#> `/Users/kylewalker/Library/R/arm64/4.5/library/sf/shape/nc.shp'
#> using driver `ESRI Shapefile'
#> Simple feature collection with 100 features and 14 fields
#> Geometry type: MULTIPOLYGON
#> Dimension: XY
#> Bounding box: xmin: -84.32385 ymin: 33.88199 xmax: -75.45698 ymax: 36.58965
#> Geodetic CRS: NAD27
# Cluster into 5 regions based on SIDS rates
result <- skater(nc, attrs = c("SID74", "SID79"), n_regions = 5)
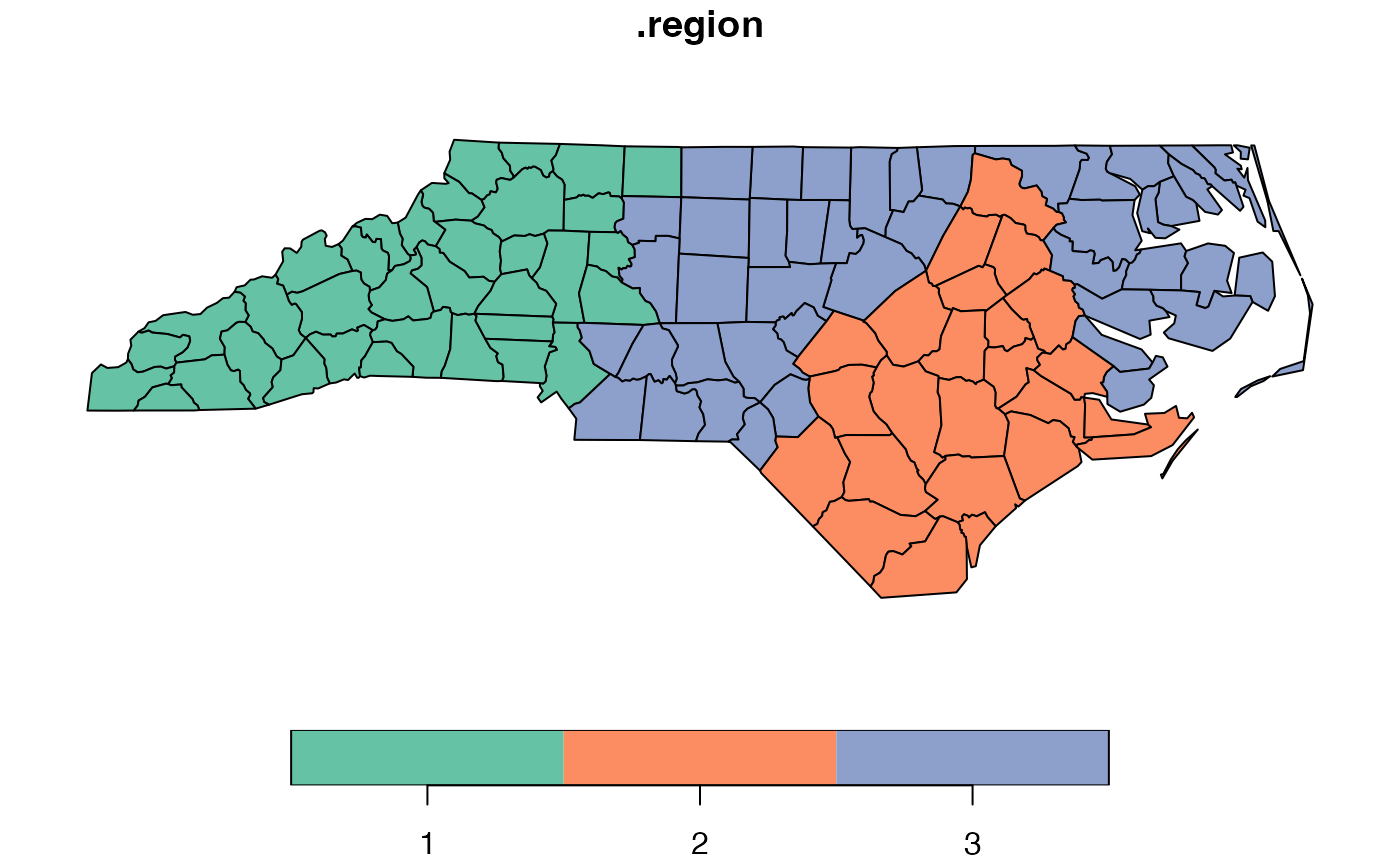
# With floor constraint: each region must have at least 100,000 births
result <- skater(nc, attrs = c("SID74", "SID79"), n_regions = 5,
floor = "BIR74", floor_value = 100000)
#> Warning: Could only create 3 regions (requested 5). Floor constraint may be too restrictive.
# View results
plot(result[".region"])
 # }
# }