Synced maps and more in mapgl 0.2.1

r
gis
mapgl
mapping
Author

Kyle Walker

Published

March 20, 2025

I’m excited to share some of the new features in the latest release of mapgl (v0.2.1). This update brings some significant enhancements to comparison maps, layer controls, and legends that make the package even more powerful for interactive mapping applications.

Synchronized side-by-side maps with mode = "sync"

Several users have requested the ability to display maps side-by-side in a synchronized view rather than the default swipe comparison in compare(). The new mode = "sync" parameter in compare() delivers exactly that.

Here’s a basic example of how you can create synchronized side-by-side maps that show a different map style and styled layer:

library(mapgl)
library(sf)

# Get some spatial data
nc <- st_read(system.file("shape/nc.shp", package="sf"))
Reading layer `nc' from data source 
  `/Library/Frameworks/R.framework/Versions/4.4-arm64/Resources/library/sf/shape/nc.shp' 
  using driver `ESRI Shapefile'
Simple feature collection with 100 features and 14 fields
Geometry type: MULTIPOLYGON
Dimension:     XY
Bounding box:  xmin: -84.32385 ymin: 33.88199 xmax: -75.45698 ymax: 36.58965
Geodetic CRS:  NAD27
# Create first map with one styling approach
m1 <- maplibre(style = carto_style("positron")) |>
  fit_bounds(nc, animate = FALSE) |>
  add_fill_layer(
    id = "nc_fill",
    source = nc,
    fill_color = "blue",
    fill_opacity = 0.6
  )

# Create second map with different styling
m2 <- maplibre(style = carto_style("dark-matter")) |>
  fit_bounds(nc, animate = FALSE) |>
  add_fill_layer(
    id = "nc_fill",
    source = nc,
    fill_color = "orange",
    fill_opacity = 0.6
  )

# Create synchronized side-by-side comparison
compare(m1, m2, mode = "sync")

The sync mode is an excellent way to compare different styling approaches, different datasets, or changes in data over time when you want to make sure each map shows in its entirety.

Comparison maps in Shiny

Another major enhancement is the ability to use comparison maps in Shiny applications, with full support for proxy-based updates. This means you can build dynamic applications where users can toggle between different layers or styles on either side of a comparison.

Users have been requesting this feature for a while - and admittedly it was a huge development lift! compare() works as a separate htmlwidget within the package, so I’ve had to build out dedicated Shiny infrastructure for it.

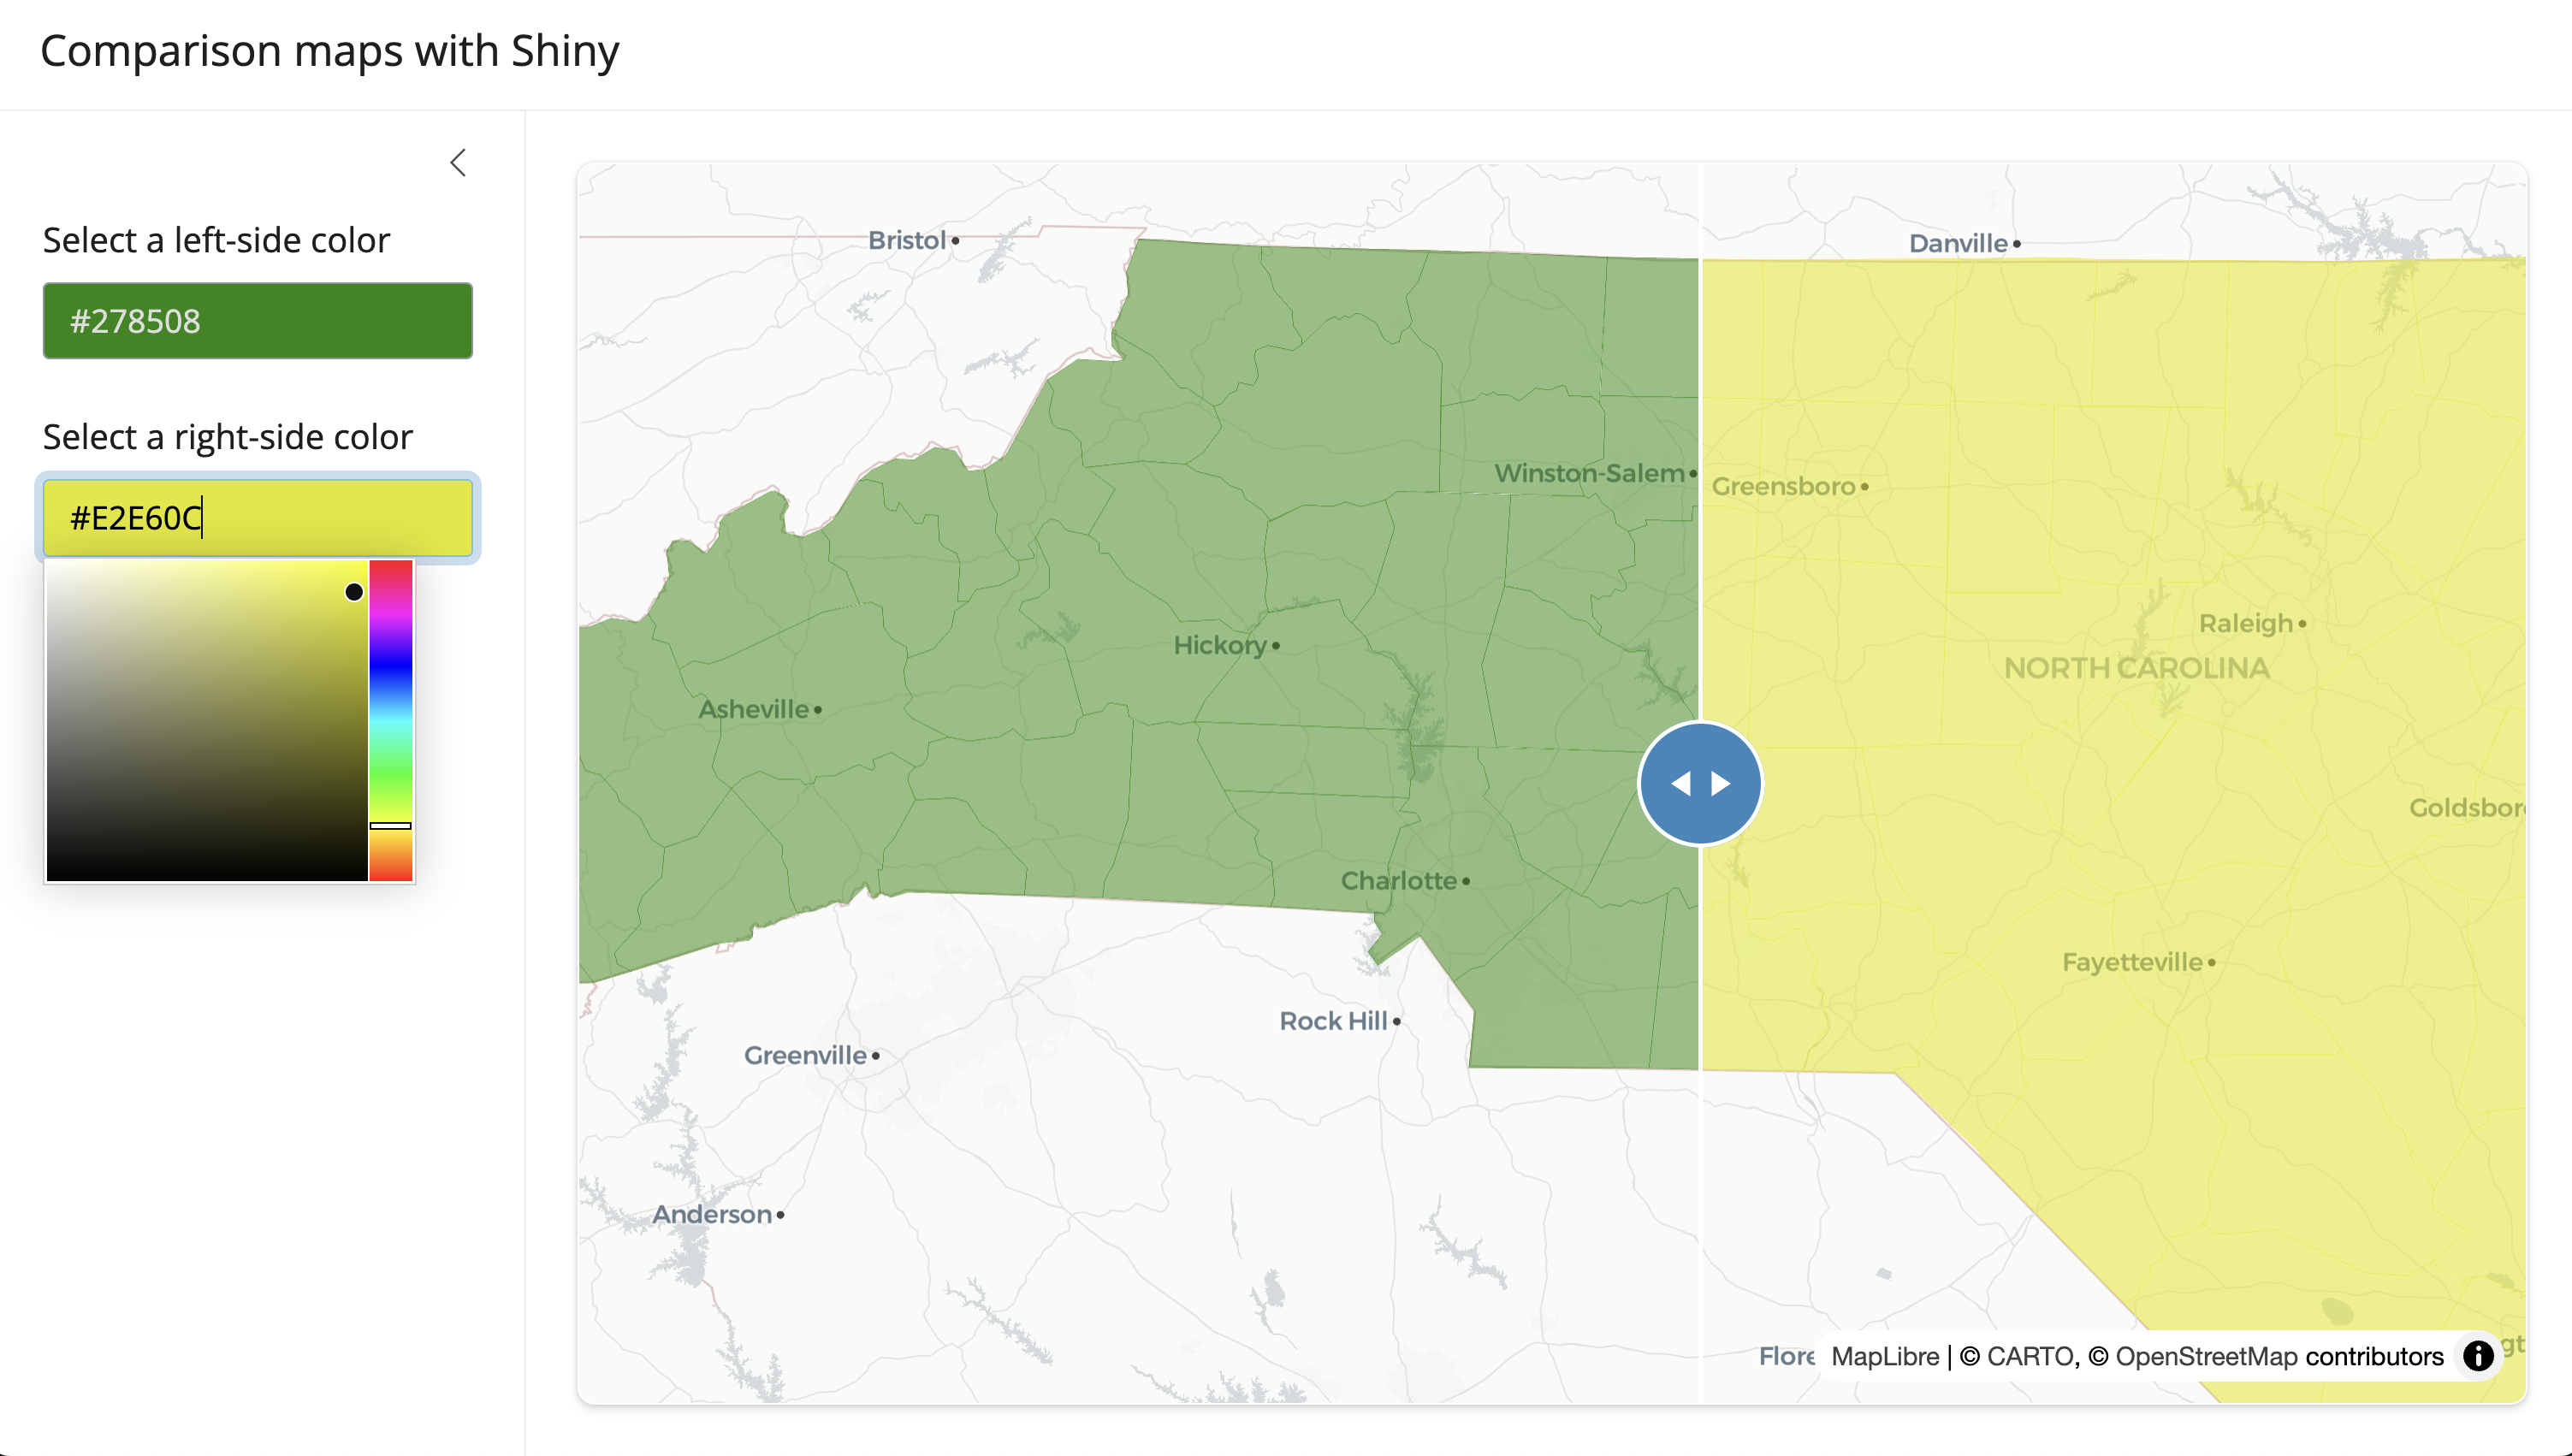
Here’s a simple app that demonstrates how you can use a comparison map in Shiny with a color picker for each side:

library(mapgl)
library(bslib)
library(shiny)
library(colourpicker)

nc <- st_read(system.file("shape/nc.shp", package="sf"))

ui <- page_sidebar(
  title = "Comparison maps with Shiny",
  sidebar = sidebar(
    colourInput("color_left", "Select a left-side color",
                value = "blue"),
    colourInput("color_right", "Select a right-side color",
                value = "orange")
  ),
  card(
    full_screen = TRUE,
    maplibreCompareOutput("map")
  )
)

server <- function(input, output, session) {
  output$map <- renderMaplibreCompare({
    map1 <- maplibre(bounds = nc, style = carto_style("positron")) |> 
      add_fill_layer(id = "nc_data_left",
                     source = nc,
                     fill_color = "blue",
                     fill_opacity = 0.5)
    
    map2 <- maplibre(bounds = nc, style = carto_style("positron")) |> 
      add_fill_layer(id = "nc_data_right",
                     source = nc,
                     fill_color = "orange",
                     fill_opacity = 0.5)
    
    compare(map1, map2)
  })
  
  observeEvent(input$color_left, {
    maplibre_compare_proxy("map", map_side = "before") |>
      set_paint_property("nc_data_left", "fill-color", input$color_left)
  })
  
  observeEvent(input$color_right, {
    maplibre_compare_proxy("map", map_side = "after") |>
      set_paint_property("nc_data_right", "fill-color", input$color_right)
  })
}

shinyApp(ui, server)

What’s really powerful about this setup is how you can target each side of the comparison independently using the map_side parameter in the proxy functions. The “before” value targets the left/top map, while “after” targets the right/bottom map.

Better styling and legend linking for the layers control

The layers control has received significant improvements in this release, with better styling, positioning behavior, and the ability to link legends to specific layers. When a layer is toggled in the layers control, its associated legend will now automatically show or hide.

Here’s how you can create a map with multiple layers, each with its own legend:

library(mapgl)
library(sf)
library(tigris)
library(tidyverse)

options(tigris_use_cache = TRUE)

travis <- counties("TX", cb = TRUE) |> 
  filter(NAME == "Travis")

travis_roads <- roads("TX", "Travis", year = 2024) |>
  mutate(sort_key = -1 * as.numeric(str_remove(MTFCC, "S")))

maplibre(style = maptiler_style("backdrop"),
         bounds = travis) |>
  add_fill_layer(
    id = "County",
    source = travis,
    fill_color = "steelblue",
    fill_opacity = 0.3,
    fill_outline_color = "navy"
  ) |>
  add_line_layer(
    id = "Roads",
    source = travis_roads,
    line_color = match_expr(
      column = "MTFCC",
      values = c("S1100", "S1200", "S1400"),
      stops = c("red", "orange", "yellow"),
      default = "gray"
    ),
    line_width = match_expr(
      column = "MTFCC",
      values = c("S1100", "S1200", "S1400"),
      stops = c(3, 2, 1),
      default = 0.5
    ),
    line_sort_key = get_column("sort_key")
  ) |>
  add_categorical_legend(
    legend_title = "Travis County Boundary",
    values = "County",
    colors = "steelblue",
    position = "bottom-left",
    layer_id = "County"
  ) |>
  add_categorical_legend(
    legend_title = "Road Network",
    values = c("Primary Roads (S1100)", "Major Roads (S1200)", "Local Roads (S1400)", "Other"),
    colors = c("red", "orange", "yellow", "gray"),
    position = "bottom-left",
    margin_bottom = 100,
    layer_id = "Roads",
    add = TRUE
  ) |>
  add_layers_control(
    position = "top-right",
    background_color = "white",
    active_color = "black",
    active_text_color = "white"
  )

The key improvement here is the addition of the layer_id parameter in add_legend(), which links the legend to a specific layer. When that layer is toggled using the layers control, its associated legend will automatically toggle as well.

Also note the new default style for the layers control, which shows a layers icon when collapsed. I’ve customized the colors here to show layers as black when active and white when inactive (the background color); you can now choose whatever fits best with your map.

The new release also adds fine-grained control over legend positioning with margin parameters:

- margin_top

- margin_right

- margin_bottom

- margin_left

These allow you to precisely position legends to avoid overlaps and create a clean layout, especially when you have multiple legends on your map.

If you have any questions or feedback about these new features, feel free to to reach out or open an issue at the package’s GitHub repository. Keep an eye out for a new interactive mapping workshop series this year as well that highlights these new features!