library(tidycensus)
library(freestiler)
options(tigris_use_cache = TRUE)

# Pulls data state-by-state, so will take a few minutes if
# geometries are not pre-cached
bgs <- get_acs(
  geography = "block group",
  variables = "B19013_001",  # median household income
  state = c(state.abb, "DC"),
  year = 2024,
  geometry = TRUE
)

freestile(
  bgs,
  "us_income.pmtiles",
  layer_name = "income",
  min_zoom = 4,
  max_zoom = 12
)This article walks through viewing and styling freestiler tilesets with the mapgl package. We’ll build a national-level choropleth of median household income by Census block group — 242,000 polygons that render smoothly because they’re served as vector tiles.
Creating the tileset
First, pull block group geometries and income data with tidycensus:
The actual tiling takes a few minutes and produces a ~250 MB tileset. The output will include:
Created us_income.pmtiles (252.6 MB)
View with: view_tiles("us_income.pmtiles")
Quick preview
For a fast look at your tileset, use view_tiles():
view_tiles("us_income.pmtiles")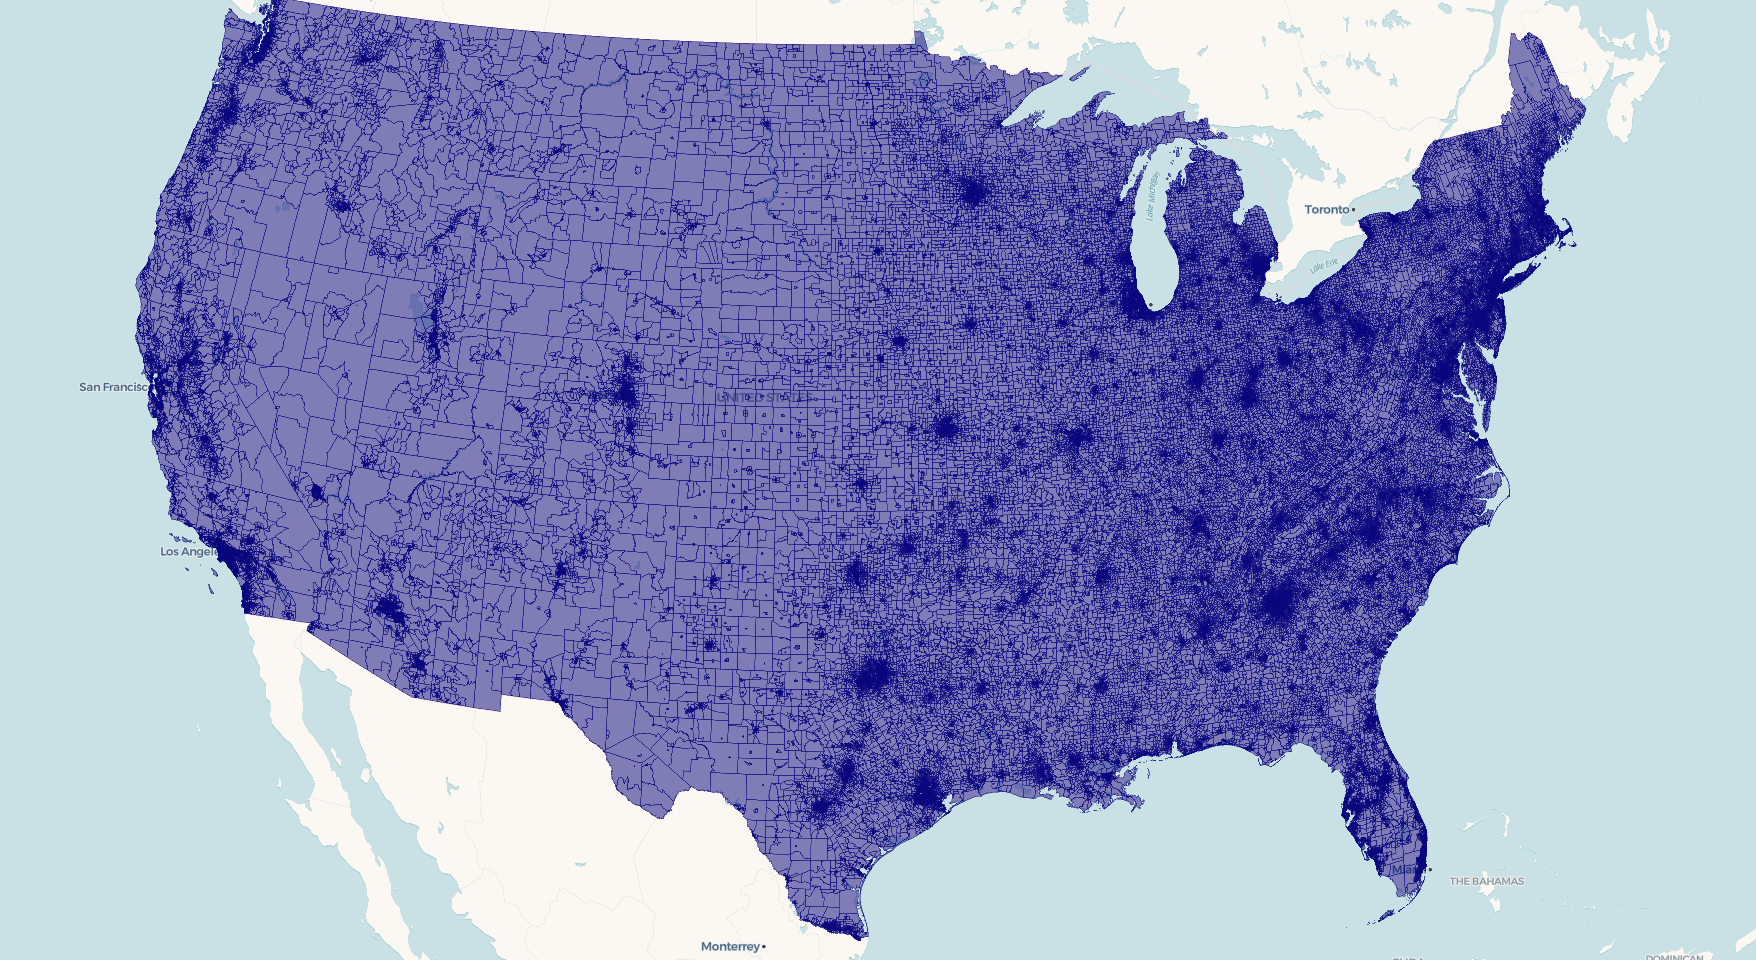
This auto-detects the layer name, geometry type, and bounds from the PMTiles metadata, starts a local server, and opens an interactive map. It works for polygon, line, and point data without any extra configuration. FYI, for this specific example - given the USA’s bounding box, you’ll need to pan over to the continental US to view it.
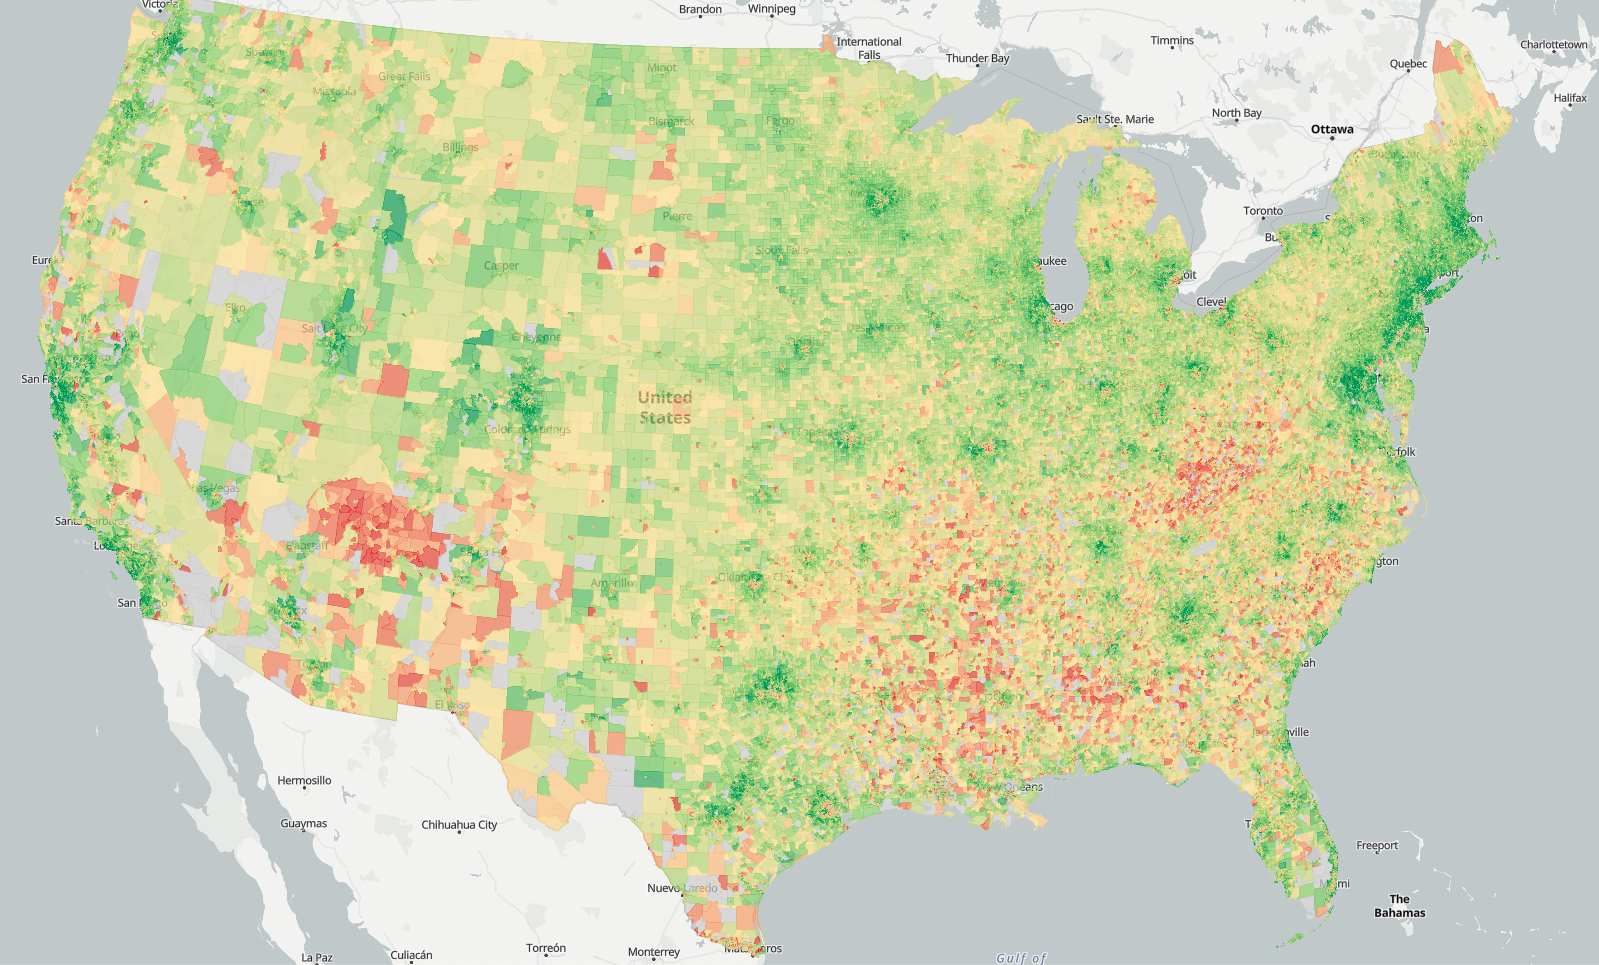
Building a custom map
For control over styling, use serve_tiles() to start the local server, then build your map with mapgl. PMTiles require a server that supports CORS and HTTP range requests — serve_tiles() handles both.
library(mapgl)

serve_tiles("us_income.pmtiles")
Now add the tileset as a source and style it:
maplibre(
  style = openfreemap_style("positron"),
  bounds = c(-125, 24, -66, 50),
) |>
  add_pmtiles_source(
    id = "income-src",
    url = "http://localhost:8080/us_income.pmtiles",
    promote_id = "GEOID"
  ) |>
  add_fill_layer(
    id = "income-fill",
    source = "income-src",
    source_layer = "income",
    fill_color = interpolate(
      column = "estimate",
      values = c(20000, 50000, 100000, 200000),
      stops = c("#d73027", "#fee08b", "#91cf60", "#1a9850"),
      na_color = "#cccccc"
    ),
    fill_opacity = 0.7,
    hover_options = list(
      fill_opacity = 1
    ),
    tooltip = concat(
      "Median income: $",
      number_format(get_column("estimate"), locale = "en")
    )
  )
Key components:
-
add_pmtiles_source()registers the PMTiles file as a vector tile source. Thepromote_idparameter tells MapLibre which property to use as the feature ID (needed for hover/click interactivity). -
source_layermust match thelayer_nameyou used infreestile(). -
interpolate()creates a data-driven color ramp. MapLibre evaluates this per-feature on the GPU, so it’s fast even at 242K polygons. -
hover_optionshighlights features on mouseover. This requirespromote_idto be set on the source. -
tooltipusesconcat()andnumber_format()to build formatted hover text from feature properties.
Line and point layers
For line data, use add_line_layer():
maplibre() |>
  add_pmtiles_source(
    id = "roads-src",
    url = "http://localhost:8080/roads.pmtiles"
  ) |>
  add_line_layer(
    id = "roads",
    source = "roads-src",
    source_layer = "roads",
    line_color = "#4a90d9",
    line_width = 1.5
  )
For point data, use add_circle_layer():
maplibre() |>
  add_pmtiles_source(
    id = "pts-src",
    url = "http://localhost:8080/airports.pmtiles"
  ) |>
  add_circle_layer(
    id = "airports",
    source = "pts-src",
    source_layer = "airports",
    circle_color = "orange",
    circle_radius = 5,
    circle_stroke_color = "white",
    circle_stroke_width = 1
  )
Multi-layer tilesets
If your tileset has multiple layers (created with a named list in freestile()), add each layer separately — they share the same source:
maplibre() |>
  add_pmtiles_source(
    id = "nc-src",
    url = "http://localhost:8080/nc_layers.pmtiles"
  ) |>
  add_fill_layer(
    id = "counties",
    source = "nc-src",
    source_layer = "counties",
    fill_color = "navy",
    fill_opacity = 0.3
  ) |>
  add_circle_layer(
    id = "centroids",
    source = "nc-src",
    source_layer = "centroids",
    circle_color = "red",
    circle_radius = 4
  )
Tile format considerations
freestiler defaults to Mapbox Vector Tiles (MVT), which has the broadest viewer compatibility across both MapLibre GL JS and Mapbox GL JS. For potentially smaller files with polygon-heavy data, you can use the experimental MapLibre Tiles (MLT) format:
freestile(bgs, "us_income_mlt.pmtiles",
  layer_name = "income",
  tile_format = "mlt"
)
Serving larger tilesets
The built-in serve_tiles() server works well for files up to about 1 GB. For larger tilesets, use an external server with better concurrency. In your terminal, assuming you have Node’s http-server installed:
npx http-server /path/to/tiles -p 8082 --cors -c-1Then point your add_pmtiles_source() URL at http://localhost:8082/... instead. Stop the external server with Ctrl+C in the terminal when you’re done.
You’ll see better performance with this method than the built-in server for datasets below 1GB as well, like the block groups dataset in this example.
Cleaning up
When you’re done viewing with the built-in server, stop it with: